Chicken Road
Share reaching each successful step
Easy roadMedium roadHard roadDaredevil road

Best Chicken Road review 1 / 2 · InOut Games · 2024
Chicken Road is InOut Games' original road-crossing casino step game. You start with a chosen stake, move a chicken forward and receive a higher available multiplier after a successful step.
Best Chicken Road research team · How we compare the games
Practice credits only. No cash withdrawals. Adults 18+.
Published RTP: 98% · Provider payout ceiling: 10,000 USD · Currency for local budgeting: INR (₹); provider stake and payout limits use USD
Open this game guideFrom there, collect the cash-out or continue along the road. A failed move ends that attempt and loses its stake. It is an easy idea to grasp because the road puts the choice directly in front of you, rather than burying it behind a long list of symbols.
What makes the game interesting is the changing size of the decision. An opening cash-out may be only a small increase over your stake. Farther along, the difference between collecting and continuing becomes more striking. You still make the same basic choice, however: keep the amount currently available or accept another random outcome. Knowing the button layout helps you play deliberately; it does not turn that next outcome into a test of skill.
InOut Games released Chicken Road on 4 April 2024. The exact title matters when you read game facts, because Chicken Road 2 is a separate product with different roads and bet settings. Choose the original in the game switcher and look for the provider name in the game information. If you have arrived through a search for Chicken Road review, that quick identity check keeps the rest of the numbers relevant.
The original uses four difficulty names: Easy, Medium, Hard and Daredevil. Each has its own step count and sequence of multipliers. The design lets you compare those ladders without changing the underlying move-or-cash-out idea. You can therefore try the controls in Easy, then look at what changes in the other modes while already understanding how a round begins and ends.
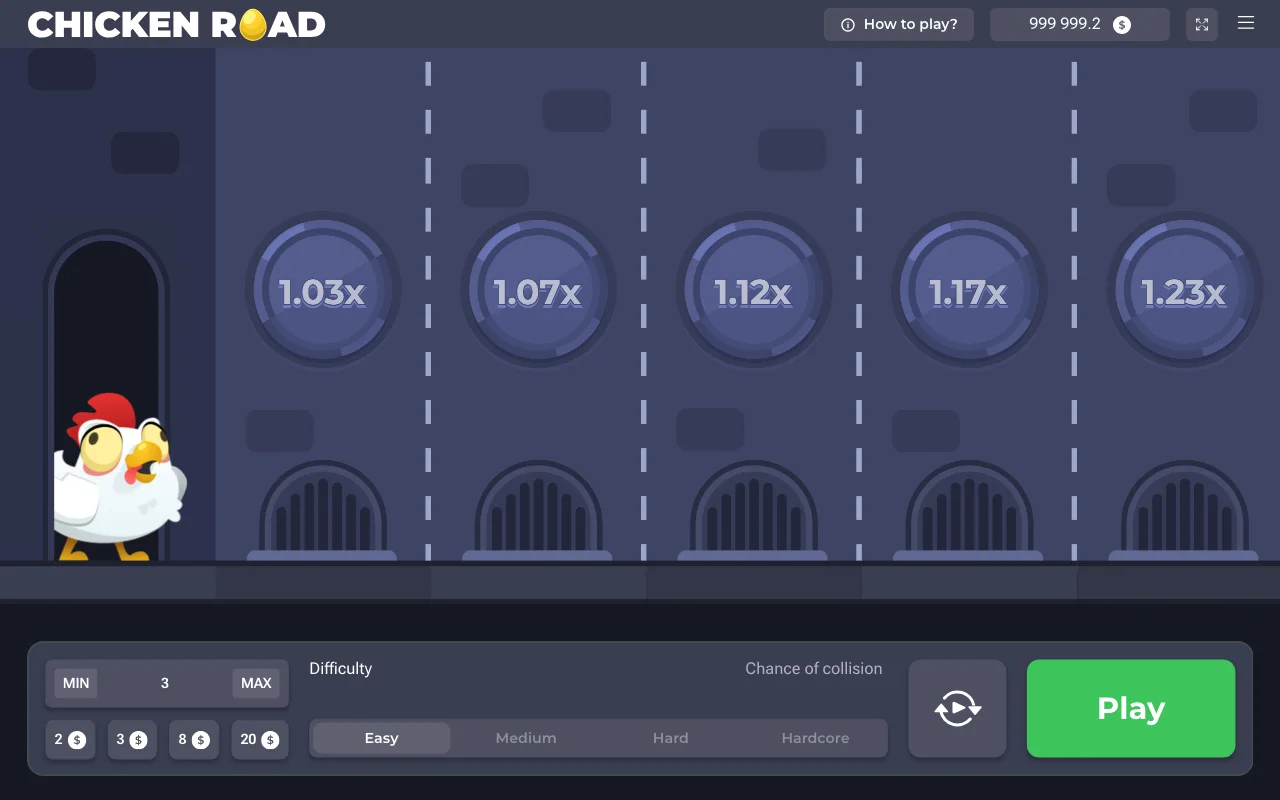
Easy starts at ×1.03 and has 24 steps, ending at ×19.44. The early part of the ladder moves through ×1.07, ×1.12, ×1.17 and ×1.23. Looking at those neighbouring values gives a clearer picture than the endpoint alone: the first successful moves add relatively small amounts to the stake. The steps later on become larger, so the amount available to collect changes more sharply as you move.
Near the end, the ladder includes ×4.90, ×6.13, ×6.61 and ×9.81 before the last ×19.44. These are positions on the road, rather than a list of amounts you receive in one round. You collect at the point where you cash out. In the demo, compare an early collection with a later attempt and watch which value appears on the cash-out control. That small exercise makes the difference between a current amount and a possible next amount much easier to read.
Medium has 22 steps and begins at ×1.12. Its following values include ×1.28, ×1.47, ×1.70 and ×1.98, with ×1,788.80 at the end. Hard shortens the road to 20 steps, begins at ×1.23 and finishes at ×41,321.43. The higher opening coefficients are the first change you notice, but the much steeper later ladder is the bigger difference when comparing the full roads.
Read the modes at matching positions as well as at their endpoints. A step number does not mean the same cash-out amount across both modes, and a shorter road does not mean an easier finish. Medium or Hard can suit a demo comparison if you want to see how quickly the available amount grows. Keep the stake fixed while changing the mode so the multiplier change stays visible instead of being mixed together with a bigger bet.
Daredevil begins at ×1.63 and has 15 steps. The first few coefficients include ×2.80, ×4.95, ×9.08 and ×15.21. Its last coefficient, ×2,542,251.93, is enormous beside the opening value. That is why the maximum-win rule belongs beside the ladder rather than hidden away as an afterthought. The original has a maximum win of 10,000 USD, which limits the payout even when the stake multiplied by a displayed coefficient would be higher.
Think of the coefficient and the cap as separate parts of the same calculation. The coefficient tells you what the step represents relative to the stake. The cap tells you the upper payout boundary. Read the game rules before relying on the uncapped amount shown by a simple calculation. Daredevil's short road can look inviting on a small screen, so compare the whole sequence in the demo rather than judging it only by the number of moves.
The original's bet range runs from 0.01 USD to 150 USD. Its maximum win is 10,000 USD. A game stake is the amount used for one round; it is different from the amount you deposit into a casino account.
Changing the stake changes both the amount at a multiplier and the money exposed in that round. It does not change the multiplier ladder into a better offer. The minimum is useful for understanding the game's scale, while the maximum describes a permitted boundary. Neither tells you what amount would be comfortable for your own session. The calculator is most helpful when you keep the selected mode, currency and payout cap in view together.
InOut publishes a theoretical RTP of 98% for Chicken Road. The remaining 2% is the house edge. These figures describe the game's long-run mathematical return across play; they are not a promise that your own session returns a particular share of your stake. Short sessions can finish well above or below that average, including a session where several attempts end before a cash-out.
RTP also differs from the chance of reaching a particular step. A high displayed coefficient needs successful progress to become an available amount. The return percentage cannot be used as a shortcut for deciding that the next move will work. You can use the RTP page to separate those ideas: theoretical return, step multiplier and the balance change in an individual round. Keeping the labels clear makes the numbers more useful than treating them as interchangeable percentages.
The ladder is the right place to check a multiplier at a given step. A results chart is the place to see how the rounds in that block ended. Read the difficulty and game title on each before comparing them. The same step number on an Easy chart and a Hard ladder can refer to very different coefficients, so matching the labels saves a misleading comparison.
The statistics blocks show the period, total and game beside each result. Actual demo results describe only the recorded rounds and do not set a schedule for the next one. A chart makes those outcomes easier to read, while the ladder explains the amounts attached to the road.
A successful move gives you a new decision. Look at the amount currently available and the multiplier beside the next move before pressing again. Cashing out closes that round at the reached value, while continuing puts the current attempt through another outcome. The animation makes the move easy to follow, but the amount on the control is the clearest place to check what you can collect now.
You can practise that reading habit with demo credits. In one round, collect after an opening move; in another, follow the changing amount for longer. The point is to understand the controls and the pace of the interface. A planned cash-out point can make your own decisions simpler, but it does not alter the random process. You can also change your plan between rounds without feeling that you need to finish the road.
Open the original from the casino lobby or use the demo to try the layout. On a phone, make sure the mode name, stake and cash-out control are readable together. Landscape view may leave more room for the road. If a browser toolbar covers part of the game, adjust the view before starting another attempt so the next decision is easy to see.
The casino handles registration, account verification and the cashier. Read currency, fees and withdrawal methods for the account you are using rather than assuming the game provider sets them. The account page explains the practical steps around login and payments.
The original is approachable because the round has a clear start, a visible ladder and an obvious collecting point. Its four modes give you plenty to compare in the demo: 24 Easy steps at one end and 15 Daredevil steps at the other. The published RTP, USD bet range and maximum win also make it possible to understand the main game figures without guessing at a sequel's rules.
Choose the original if you want to begin with that particular ladder and explore the controls at your own pace. Choose the comparison page if you want to see the longer roads in Chicken Road 2 beside it. The right starting point is the version whose screen and rules you understand, with a clear distinction between a possible multiplier and an amount already available to collect.
Keep play optional when reading the original game. Adults 18+ only. Set time and spending limits. Take breaks. Never chase losses.
Inside our demo results
Fixed starting denominator. Shading: pointwise Wilson intervals.
Demo rounds counted: 6,000
Share reaching each successful step
| Game | Road setting | Demo rounds counted | Step one survival | Uncertainty around this share | Completed roads | Highest multiplier reached |
|---|---|---|---|---|---|---|
| Chicken Road · Easy road | Easy road | 1,500 | 95.27% | 94.07%–96.23% | 72 | 19.44× |
| Chicken Road · Medium road | Medium road | 1,500 | 87.87% | 86.12%–89.42% | 2 | 1,788.8× |
| Chicken Road · Hard road | Hard road | 1,500 | 80.33% | 78.25%–82.27% | 0 | 6,956.47× |
| Chicken Road · Daredevil road | Daredevil road | 1,500 | 60.47% | 57.97%–62.91% | 0 | 337.19× |
Highest successful coefficient, including later losses. No paid prize.
| Step reached | Successful rounds | Demo rounds counted | Share reaching this step | Uncertainty around this share |
|---|---|---|---|---|
| 1 | 1,429 | 1,500 | 95.27% | 94.07%–96.23% |
| 2 | 1,375 | 1,500 | 91.67% | 90.16%–92.96% |
| 3 | 1,297 | 1,500 | 86.47% | 84.64%–88.1% |
| 4 | 1,227 | 1,500 | 81.8% | 79.77%–83.67% |
| 5 | 1,171 | 1,500 | 78.07% | 75.9%–80.09% |
| 6 | 1,107 | 1,500 | 73.8% | 71.52%–75.96% |
| 7 | 1,048 | 1,500 | 69.87% | 67.5%–72.14% |
| 8 | 989 | 1,500 | 65.93% | 63.5%–68.29% |
| 9 | 937 | 1,500 | 62.47% | 59.99%–64.88% |
| 10 | 867 | 1,500 | 57.8% | 55.28%–60.28% |
| 11 | 807 | 1,500 | 53.8% | 51.27%–56.31% |
| 12 | 751 | 1,500 | 50.07% | 47.54%–52.59% |
| 13 | 684 | 1,500 | 45.6% | 43.09%–48.13% |
| 14 | 636 | 1,500 | 42.4% | 39.92%–44.92% |
| 15 | 582 | 1,500 | 38.8% | 36.37%–41.29% |
| 16 | 519 | 1,500 | 34.6% | 32.23%–37.04% |
| 17 | 456 | 1,500 | 30.4% | 28.12%–32.78% |
| 18 | 400 | 1,500 | 26.67% | 24.49%–28.96% |
| 19 | 341 | 1,500 | 22.73% | 20.68%–24.92% |
| 20 | 303 | 1,500 | 20.2% | 18.25%–22.31% |
| 21 | 250 | 1,500 | 16.67% | 14.87%–18.64% |
| 22 | 183 | 1,500 | 12.2% | 10.64%–13.95% |
| 23 | 131 | 1,500 | 8.73% | 7.41%–10.27% |
| 24 | 72 | 1,500 | 4.8% | 3.83%–6% |
| Step reached | Successful rounds | Demo rounds counted | Share reaching this step | Uncertainty around this share |
|---|---|---|---|---|
| 1 | 1,318 | 1,500 | 87.87% | 86.12%–89.42% |
| 2 | 1,146 | 1,500 | 76.4% | 74.19%–78.48% |
| 3 | 995 | 1,500 | 66.33% | 63.9%–68.68% |
| 4 | 863 | 1,500 | 57.53% | 55.02%–60.01% |
| 5 | 740 | 1,500 | 49.33% | 46.81%–51.86% |
| 6 | 643 | 1,500 | 42.87% | 40.38%–45.39% |
| 7 | 538 | 1,500 | 35.87% | 33.48%–38.33% |
| 8 | 455 | 1,500 | 30.33% | 28.06%–32.71% |
| 9 | 366 | 1,500 | 24.4% | 22.29%–26.64% |
| 10 | 287 | 1,500 | 19.13% | 17.22%–21.2% |
| 11 | 233 | 1,500 | 15.53% | 13.79%–17.45% |
| 12 | 182 | 1,500 | 12.13% | 10.58%–13.88% |
| 13 | 138 | 1,500 | 9.2% | 7.84%–10.77% |
| 14 | 102 | 1,500 | 6.8% | 5.63%–8.19% |
| 15 | 74 | 1,500 | 4.93% | 3.95%–6.15% |
| 16 | 47 | 1,500 | 3.13% | 2.36%–4.14% |
| 17 | 33 | 1,500 | 2.2% | 1.57%–3.07% |
| 18 | 15 | 1,500 | 1% | 0.61%–1.64% |
| 19 | 13 | 1,500 | 0.87% | 0.51%–1.48% |
| 20 | 5 | 1,500 | 0.33% | 0.14%–0.78% |
| 21 | 3 | 1,500 | 0.2% | 0.07%–0.59% |
| 22 | 2 | 1,500 | 0.13% | 0.04%–0.48% |
| Step reached | Successful rounds | Demo rounds counted | Share reaching this step | Uncertainty around this share |
|---|---|---|---|---|
| 1 | 1,205 | 1,500 | 80.33% | 78.25%–82.27% |
| 2 | 949 | 1,500 | 63.27% | 60.8%–65.67% |
| 3 | 728 | 1,500 | 48.53% | 46.01%–51.06% |
| 4 | 578 | 1,500 | 38.53% | 36.1%–41.02% |
| 5 | 428 | 1,500 | 28.53% | 26.31%–30.87% |
| 6 | 330 | 1,500 | 22% | 19.98%–24.17% |
| 7 | 244 | 1,500 | 16.27% | 14.49%–18.22% |
| 8 | 166 | 1,500 | 11.07% | 9.58%–12.75% |
| 9 | 110 | 1,500 | 7.33% | 6.12%–8.76% |
| 10 | 80 | 1,500 | 5.33% | 4.31%–6.59% |
| 11 | 49 | 1,500 | 3.27% | 2.48%–4.29% |
| 12 | 35 | 1,500 | 2.33% | 1.68%–3.23% |
| 13 | 22 | 1,500 | 1.47% | 0.97%–2.21% |
| 14 | 10 | 1,500 | 0.67% | 0.36%–1.22% |
| 15 | 7 | 1,500 | 0.47% | 0.23%–0.96% |
| 16 | 4 | 1,500 | 0.27% | 0.1%–0.68% |
| 17 | 1 | 1,500 | 0.07% | 0.01%–0.38% |
| 18 | 1 | 1,500 | 0.07% | 0.01%–0.38% |
| 19 | 1 | 1,500 | 0.07% | 0.01%–0.38% |
| 20 | 0 | 1,500 | 0% | 0%–0.26% |
| Step reached | Successful rounds | Demo rounds counted | Share reaching this step | Uncertainty around this share |
|---|---|---|---|---|
| 1 | 907 | 1,500 | 60.47% | 57.97%–62.91% |
| 2 | 539 | 1,500 | 35.93% | 33.54%–38.39% |
| 3 | 302 | 1,500 | 20.13% | 18.18%–22.24% |
| 4 | 169 | 1,500 | 11.27% | 9.76%–12.97% |
| 5 | 86 | 1,500 | 5.73% | 4.67%–7.03% |
| 6 | 44 | 1,500 | 2.93% | 2.19%–3.91% |
| 7 | 19 | 1,500 | 1.27% | 0.81%–1.97% |
| 8 | 7 | 1,500 | 0.47% | 0.23%–0.96% |
| 9 | 1 | 1,500 | 0.07% | 0.01%–0.38% |
| 10 | 0 | 1,500 | 0% | 0%–0.26% |
| 11 | 0 | 1,500 | 0% | 0%–0.26% |
| 12 | 0 | 1,500 | 0% | 0%–0.26% |
| 13 | 0 | 1,500 | 0% | 0%–0.26% |
| 14 | 0 | 1,500 | 0% | 0%–0.26% |
| 15 | 0 | 1,500 | 0% | 0%–0.26% |
Demo observations only. No outcome predictions. No independent RTP audit.
18+ only. Set limits. Take breaks. Never chase losses.
Model: stated RTP divided by multiplier. Independently unverified.
| Step reached | Share reaching this step | Uncertainty around this share | Modelled survival |
|---|---|---|---|
| 1 | 95.27% | 94.07% – 96.23% | 95.15% |
| 2 | 91.67% | 90.16% – 92.96% | 91.59% |
| 3 | 86.47% | 84.64% – 88.1% | 87.5% |
| 4 | 81.8% | 79.77% – 83.67% | 83.76% |
| 5 | 78.07% | 75.9% – 80.09% | 79.67% |
| 6 | 73.8% | 71.52% – 75.96% | 75.97% |
| 7 | 69.87% | 67.5% – 72.14% | 72.06% |
| 8 | 65.93% | 63.5% – 68.29% | 68.06% |
| 9 | 62.47% | 59.99% – 64.88% | 64.05% |
| 10 | 57.8% | 55.28% – 60.28% | 60.12% |
| 11 | 53.8% | 51.27% – 56.31% | 56% |
| 12 | 50.07% | 47.54% – 52.59% | 52.13% |
| 13 | 45.6% | 43.09% – 48.13% | 48.04% |
| 14 | 42.4% | 39.92% – 44.92% | 44.14% |
| 15 | 38.8% | 36.37% – 41.29% | 40% |
| 16 | 34.6% | 32.23% – 37.04% | 36.03% |
| 17 | 30.4% | 28.12% – 32.78% | 32.03% |
| 18 | 26.67% | 24.49% – 28.96% | 28% |
| 19 | 22.73% | 20.68% – 24.92% | 24.02% |
| 20 | 20.2% | 18.25% – 22.31% | 20% |
| 21 | 16.67% | 14.87% – 18.64% | 15.99% |
| 22 | 12.2% | 10.64% – 13.95% | 14.83% |
| 23 | 8.73% | 7.41% – 10.27% | 9.99% |
| 24 | 4.8% | 3.83% – 6% | 5.04% |
| Step reached | Share reaching this step | Uncertainty around this share | Modelled survival |
|---|---|---|---|
| 1 | 87.87% | 86.12% – 89.42% | 87.5% |
| 2 | 76.4% | 74.19% – 78.48% | 76.56% |
| 3 | 66.33% | 63.9% – 68.68% | 66.67% |
| 4 | 57.53% | 55.02% – 60.01% | 57.65% |
| 5 | 49.33% | 46.81% – 51.86% | 49.49% |
| 6 | 42.87% | 40.38% – 45.39% | 42.06% |
| 7 | 35.87% | 33.48% – 38.33% | 35.51% |
| 8 | 30.33% | 28.06% – 32.71% | 29.52% |
| 9 | 24.4% | 22.29% – 26.64% | 24.32% |
| 10 | 19.13% | 17.22% – 21.2% | 19.76% |
| 11 | 15.53% | 13.79% – 17.45% | 15.81% |
| 12 | 12.13% | 10.58% – 13.88% | 14.18% |
| 13 | 9.2% | 7.84% – 10.77% | 11.01% |
| 14 | 6.8% | 5.63% – 8.19% | 8.35% |
| 15 | 4.93% | 3.95% – 6.15% | 6.13% |
| 16 | 3.13% | 2.36% – 4.14% | 4.33% |
| 17 | 2.2% | 1.57% – 3.07% | 2.92% |
| 18 | 1% | 0.61% – 1.64% | 1.84% |
| 19 | 0.87% | 0.51% – 1.48% | 1.06% |
| 20 | 0.33% | 0.14% – 0.78% | 0.54% |
| 21 | 0.2% | 0.07% – 0.59% | 0.22% |
| 22 | 0.13% | 0.04% – 0.48% | 0.05% |
| Step reached | Share reaching this step | Uncertainty around this share | Modelled survival |
|---|---|---|---|
| 1 | 80.33% | 78.25% – 82.27% | 79.67% |
| 2 | 63.27% | 60.8% – 65.67% | 63.23% |
| 3 | 48.53% | 46.01% – 51.06% | 49.49% |
| 4 | 38.53% | 36.1% – 41.02% | 38.28% |
| 5 | 28.53% | 26.31% – 30.87% | 29.17% |
| 6 | 22% | 19.98% – 24.17% | 21.83% |
| 7 | 16.27% | 14.49% – 18.22% | 17.85% |
| 8 | 11.07% | 9.58% – 12.75% | 13.01% |
| 9 | 7.33% | 6.12% – 8.76% | 9.28% |
| 10 | 5.33% | 4.31% – 6.59% | 6.44% |
| 11 | 3.27% | 2.48% – 4.29% | 4.34% |
| 12 | 2.33% | 1.68% – 3.23% | 2.82% |
| 13 | 1.47% | 0.97% – 2.21% | 1.75% |
| 14 | 0.67% | 0.36% – 1.22% | 1.03% |
| 15 | 0.47% | 0.23% – 0.96% | 0.57% |
| 16 | 0.27% | 0.1% – 0.68% | 0.29% |
| 17 | 0.07% | 0.01% – 0.38% | 0.13% |
| 18 | 0.07% | 0.01% – 0.38% | 0.05% |
| 19 | 0.07% | 0.01% – 0.38% | 0.01% |
| 20 | 0% | 0% – 0.26% | 0% |
| Step reached | Share reaching this step | Uncertainty around this share | Modelled survival |
|---|---|---|---|
| 1 | 60.47% | 57.97% – 62.91% | 60.12% |
| 2 | 35.93% | 33.54% – 38.39% | 35% |
| 3 | 20.13% | 18.18% – 22.24% | 19.8% |
| 4 | 11.27% | 9.76% – 12.97% | 10.79% |
| 5 | 5.73% | 4.67% – 7.03% | 6.44% |
| 6 | 2.93% | 2.19% – 3.91% | 3.25% |
| 7 | 1.27% | 0.81% – 1.97% | 1.56% |
| 8 | 0.47% | 0.23% – 0.96% | 0.7% |
| 9 | 0.07% | 0.01% – 0.38% | 0.29% |
| 10 | 0% | 0% – 0.26% | 0.11% |
| 11 | 0% | 0% – 0.26% | 0.04% |
| 12 | 0% | 0% – 0.26% | 0.01% |
| 13 | 0% | 0% – 0.26% | 0% |
| 14 | 0% | 0% – 0.26% | 0% |
| 15 | 0% | 0% – 0.26% | 0% |
Casino games can lose money, including games with a high theoretical RTP. The demo lets you try these controls without putting cash into a round.
InOut does not provide a standalone Chicken Road mobile app. Use the browser version; the app page explains the mobile options.
The InOut road-crossing casino game is Chicken Road. Check the provider and title inside the game to distinguish it from other chicken-themed games.
You can collect a successful round through cash-out, but you can also lose the stake. It is gambling rather than a regular income source.
No. The 98% theoretical return describes long-run game maths. It does not set a refund amount for your deposit or your session.
No. A stake starts one round, while a deposit adds money to a casino balance. Read the game currency and the cashier separately.
Road length in steps: 24
Starting step multiplier: 1.03×
Final step multiplier: 19.44×
Hazards along the road: Figure unavailable
Road length in steps: 22
Starting step multiplier: 1.12×
Final step multiplier: 1,788.8×
Hazards along the road: Figure unavailable
Road length in steps: 20
Starting step multiplier: 1.23×
Final step multiplier: 41,321.43×
Hazards along the road: Figure unavailable
Road length in steps: 15
Starting step multiplier: 1.63×
Final step multiplier: 25,42,251.93×
Hazards along the road: Figure unavailable
| Step reached | Return multiplier | Modelled survival | Share reaching this step | Gross demo return per unit staked |
|---|---|---|---|---|
| 1 | 1.03× | 95.15% | 95.27% | 0.981 |
| 2 | 1.07× | 91.59% | 91.67% | 0.981 |
| 3 | 1.12× | 87.5% | 86.47% | 0.968 |
| 4 | 1.17× | 83.76% | 81.8% | 0.957 |
| 5 | 1.23× | 79.67% | 78.07% | 0.96 |
| 6 | 1.29× | 75.97% | 73.8% | 0.952 |
| 7 | 1.36× | 72.06% | 69.87% | 0.95 |
| 8 | 1.44× | 68.06% | 65.93% | 0.949 |
| 9 | 1.53× | 64.05% | 62.47% | 0.956 |
| 10 | 1.63× | 60.12% | 57.8% | 0.942 |
| 11 | 1.75× | 56% | 53.8% | 0.942 |
| 12 | 1.88× | 52.13% | 50.07% | 0.941 |
| 13 | 2.04× | 48.04% | 45.6% | 0.93 |
| 14 | 2.22× | 44.14% | 42.4% | 0.941 |
| 15 | 2.45× | 40% | 38.8% | 0.951 |
| 16 | 2.72× | 36.03% | 34.6% | 0.941 |
| 17 | 3.06× | 32.03% | 30.4% | 0.93 |
| 18 | 3.5× | 28% | 26.67% | 0.933 |
| 19 | 4.08× | 24.02% | 22.73% | 0.928 |
| 20 | 4.9× | 20% | 20.2% | 0.99 |
| 21 | 6.13× | 15.99% | 16.67% | 1.022 |
| 22 | 6.61× | 14.83% | 12.2% | 0.806 |
| 23 | 9.81× | 9.99% | 8.73% | 0.857 |
| 24 | 19.44× | 5.04% | 4.8% | 0.933 |
| Step reached | Return multiplier | Modelled survival | Share reaching this step | Gross demo return per unit staked |
|---|---|---|---|---|
| 1 | 1.12× | 87.5% | 87.87% | 0.984 |
| 2 | 1.28× | 76.56% | 76.4% | 0.978 |
| 3 | 1.47× | 66.67% | 66.33% | 0.975 |
| 4 | 1.7× | 57.65% | 57.53% | 0.978 |
| 5 | 1.98× | 49.49% | 49.33% | 0.977 |
| 6 | 2.33× | 42.06% | 42.87% | 0.999 |
| 7 | 2.76× | 35.51% | 35.87% | 0.99 |
| 8 | 3.32× | 29.52% | 30.33% | 1.007 |
| 9 | 4.03× | 24.32% | 24.4% | 0.983 |
| 10 | 4.96× | 19.76% | 19.13% | 0.949 |
| 11 | 6.2× | 15.81% | 15.53% | 0.963 |
| 12 | 6.91× | 14.18% | 12.13% | 0.838 |
| 13 | 8.9× | 11.01% | 9.2% | 0.819 |
| 14 | 11.74× | 8.35% | 6.8% | 0.798 |
| 15 | 15.99× | 6.13% | 4.93% | 0.789 |
| 16 | 22.61× | 4.33% | 3.13% | 0.708 |
| 17 | 33.58× | 2.92% | 2.2% | 0.739 |
| 18 | 53.2× | 1.84% | 1% | 0.532 |
| 19 | 92.17× | 1.06% | 0.87% | 0.799 |
| 20 | 182.51× | 0.54% | 0.33% | 0.608 |
| 21 | 451.71× | 0.22% | 0.2% | 0.903 |
| 22 | 1,788.8× | 0.05% | 0.13% | 2.385 |
| Step reached | Return multiplier | Modelled survival | Share reaching this step | Gross demo return per unit staked |
|---|---|---|---|---|
| 1 | 1.23× | 79.67% | 80.33% | 0.988 |
| 2 | 1.55× | 63.23% | 63.27% | 0.981 |
| 3 | 1.98× | 49.49% | 48.53% | 0.961 |
| 4 | 2.56× | 38.28% | 38.53% | 0.986 |
| 5 | 3.36× | 29.17% | 28.53% | 0.959 |
| 6 | 4.49× | 21.83% | 22% | 0.988 |
| 7 | 5.49× | 17.85% | 16.27% | 0.893 |
| 8 | 7.53× | 13.01% | 11.07% | 0.833 |
| 9 | 10.56× | 9.28% | 7.33% | 0.774 |
| 10 | 15.21× | 6.44% | 5.33% | 0.811 |
| 11 | 22.59× | 4.34% | 3.27% | 0.738 |
| 12 | 34.79× | 2.82% | 2.33% | 0.812 |
| 13 | 55.97× | 1.75% | 1.47% | 0.821 |
| 14 | 94.99× | 1.03% | 0.67% | 0.633 |
| 15 | 172.42× | 0.57% | 0.47% | 0.805 |
| 16 | 341.4× | 0.29% | 0.27% | 0.91 |
| 17 | 760.46× | 0.13% | 0.07% | 0.507 |
| 18 | 2,007.63× | 0.05% | 0.07% | 1.338 |
| 19 | 6,956.47× | 0.01% | 0.07% | 4.638 |
| 20 | 41,321.43× | 0% | 0% | 0 |
| Step reached | Return multiplier | Modelled survival | Share reaching this step | Gross demo return per unit staked |
|---|---|---|---|---|
| 1 | 1.63× | 60.12% | 60.47% | 0.986 |
| 2 | 2.8× | 35% | 35.93% | 1.006 |
| 3 | 4.95× | 19.8% | 20.13% | 0.997 |
| 4 | 9.08× | 10.79% | 11.27% | 1.023 |
| 5 | 15.21× | 6.44% | 5.73% | 0.872 |
| 6 | 30.12× | 3.25% | 2.93% | 0.884 |
| 7 | 62.96× | 1.56% | 1.27% | 0.797 |
| 8 | 140.24× | 0.7% | 0.47% | 0.654 |
| 9 | 337.19× | 0.29% | 0.07% | 0.225 |
| 10 | 890.19× | 0.11% | 0% | 0 |
| 11 | 2,643.89× | 0.04% | 0% | 0 |
| 12 | 9,161.08× | 0.01% | 0% | 0 |
| 13 | 39,301.05× | 0% | 0% | 0 |
| 14 | 2,33,448.29× | 0% | 0% | 0 |
| 15 | 25,42,251.93× | 0% | 0% | 0 |
Gross return, before caps. No profit forecast.
Limited demo observations. Future outcomes remain unknown.
Chicken Road

Published RTP: 95.5% · Provider payout ceiling: 20,000 USD · Currency for local budgeting: INR (₹); provider stake and payout limits use USD
Outcome system: no independent audit by us.
Check algorithm, seed commitments, seeds and nonce.